All these buzz words are tools used to optimize manufacturing processes, that is, minimize risk and stay competitive. Let's get to it!
We will become your reliable partner, offering IT and statistical competence, from conceptual planning down to implementation. Nobody knows your processes better than you, and so we always seek to incorporate your insights into configuration of our software so it can best answer your needs.
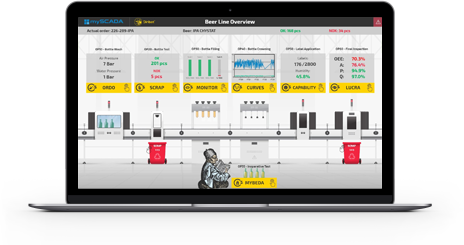
Chy.stat works in real time, presenting all measured quality characteristics, as well as process and energy parameters. We also offer clever alarms and quick analysis of your data.
Oh yeah and the licensing policy is pretty fair.